What Percentile Is Your Bowling Average? Data From 7,500 Bowlers
We analyzed the averages of about 7,500 bowlers who logged 10+ games in a year with the Bosc score app. The median average is 157 and only 7.8% average 200+. Includes a percentile chart and a US vs Japan comparison.
22 Oct, 2026"Where does my bowling average rank among people who bowl regularly?"
We analyzed about 680,000 games logged in Bosc, a bowling score tracking app, and calculated the averages of 7,517 bowlers who logged at least 10 games in a year. Below is the distribution of bowling averages and what percentile each average puts you in, explained with four charts and tables.
Key Findings
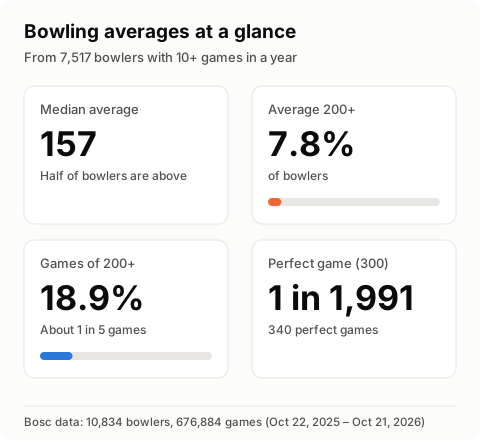
- The median bowling average is 157 — half of bowlers are above it
- Only 7.8% average 200+ (about 1 in 13), and 23.5% average 180+
- Game by game, 18.9% of games are 200+ (about 1 in 5)
- A perfect 300 game happens once every 1,991 games
- US bowlers' median average is about 8 pins lower than bowlers in Japan
About the Data
| Item | Details |
|---|---|
| Bowlers | 7,517 Bosc users who logged 10+ games in the period (game-level stats use all 10,834 users) |
| Period | Oct 22, 2025 – Oct 21, 2026 (date bowled) |
| Games | 676,884 games |
| Average | Mean score of all games logged in the period |
- Only aggregated figures that cannot identify any individual are published. Groups with fewer than 30 bowlers are excluded.
- These are people who keep tracking their scores, so averages run higher than for everyone who bowls, including people who bowl a few times a year. For casual benchmarks, see What Is the Average Bowling Score?
Bowling Average Distribution
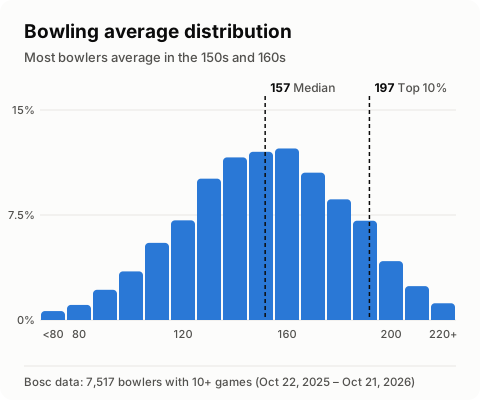
The 150s (12.0%) and 160s (12.3%) are the most common averages, tapering off gradually in both directions. 12.9% of bowlers average under 120, and 7.8% average 200+.
What Percentile Is Your Average?
| Average | Percentile |
|---|---|
| 222 | Top 1% |
| 197 | Top 10% |
| 179 | Top 25% |
| 157 | Median (top 50%) |
| 135 | Bottom 25% |
| 115 | Bottom 10% |
| Average | Share of bowlers at or above |
|---|---|
| 120+ | 87.1% |
| 150+ | 58.3% |
| 180+ | 23.5% |
| 200+ | 7.8% |
| 220+ | 1.2% |
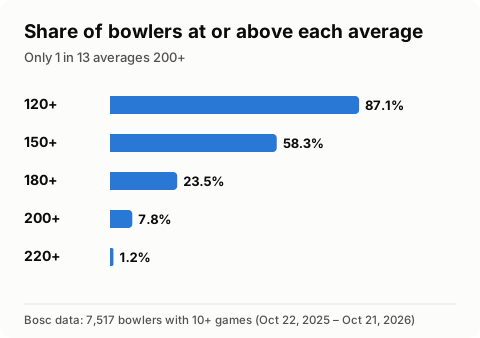
A 150 average puts you around the top 58% — right in the middle among regular bowlers. Break 180 and you're in the top quarter; break 200 and you're in the top 10%.
200 Games and Perfect Games
| Item | Value |
|---|---|
| Median game score | 164 |
| Games of 200+ | 18.9% (about 1 in 5) |
| Games of 250+ | 1.6% (about 1 in 60) |
| Perfect games (300) | 340 (1 in 1,991 games) |
Only 7.8% of bowlers average 200+, but 1 in 5 individual games ends at 200 or higher. Bowling your first 200 is well within reach for anyone who bowls regularly.
To see how many strikes a 200 game takes, read How Many Strikes Do You Need to Bowl a 200?
US vs Japan
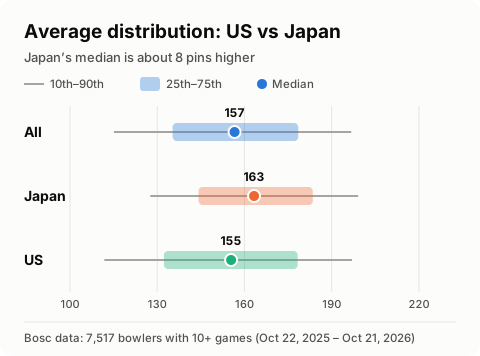
| Item | All | US | Japan |
|---|---|---|---|
| Bottom 10% | 115 | 112 | 128 |
| Bottom 25% | 135 | 132 | 144 |
| Median | 157 | 155 | 163 |
| Top 25% | 179 | 178 | 184 |
| Top 10% | 197 | 197 | 199 |
| Share averaging 200+ | 7.8% | 7.8% | 9.1% |
| Bowlers | 7,517 | 3,199 | 1,565 |
Bowlers in Japan have a median about 8 pins higher, with the biggest gap among lower averages (16 pins at the bottom 10%), while the top 10% cutoff is nearly the same. Country is based on each device's region setting.
How to Know Your True Average
One or two games involve a lot of luck — your average over 10 or more games is a much better measure of your skill. To see how much bowlers who keep tracking improve, read Does Tracking Your Scores Make You a Better Bowler?
With the Bosc score tracking app, just log your scores and Bosc tracks your monthly average and high scores automatically. Compare yours with the distribution in this article.
The fastest way to raise your average is to make the spares you should make. See conversion rates for every leave in Bowling Spare Conversion Rates by Leave.
FAQ
Is a 150 bowling average good?
Among Bosc users who log 10+ games a year, a 150 average is around the top 58% — right in the middle. Compared with everyone who bowls, including casual bowlers, 150 is a solid average.
What percentage of bowlers average 200?
In Bosc data, 7.8% of bowlers average 200 or higher — about 1 in 13. 23.5% average 180 or higher.
What are the odds of bowling a perfect game?
Of the 676,884 games logged in Bosc, 340 were perfect 300 games — once every 1,991 games.
Data in this article comes from scores logged by users of the Bosc bowling score app, aggregated so that no individual can be identified (compiled Oct 22, 2026). If you cite these figures, please link to this article as the source.