Bowling Spare Conversion Rates by Leave: Data From 220,000 Games
We analyzed about 220,000 games logged in the Bosc bowling score app to find the spare conversion rate for every common leave. Single 10 pin: 63.7%. 7-10 split: 0.5%. Includes breakdowns by bowling average and US vs Japan.
22 Oct, 2026"How often do other bowlers actually pick up the 10 pin?"
We analyzed about 220,000 games (roughly 1.39 million frames) logged in Bosc, a bowling score tracking app, where bowlers recorded which pins they knocked down on the first ball and whether they made the spare. Below are spare conversion rates for each leave, explained with four charts and tables.
Key Findings
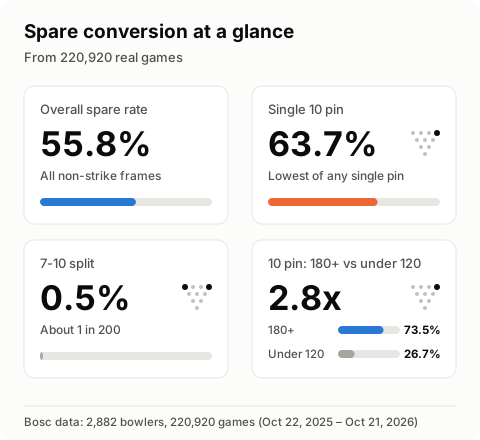
- Across all non-strike frames, the overall spare conversion rate is about 56%
- The most common leave is the single 10 pin (13.5% of all non-strike frames), and it is converted only 63.7% of the time — the lowest of any single pin
- The 7-10 split is converted 0.5% of the time and the 4-6-7-10 (Big Four) 0.3%, regardless of skill level
- Bowlers averaging 180+ convert the 10 pin 73.5% of the time; bowlers averaging under 120 convert it 26.7%
- Making single-pin spares, not splits, is what separates higher averages from lower ones
About the Data
| Item | Details |
|---|---|
| Bowlers | 2,882 Bosc users who record which pins fell on the first ball |
| Period | Oct 22, 2025 – Oct 21, 2026 (date bowled) |
| Games | 220,920 games (1,388,985 non-strike frames with pin data) |
| Conversion | All remaining pins knocked down on the second ball (a spare) |
- Only aggregated figures that cannot identify any individual are published. Groups with fewer than 30 bowlers are excluded.
- Bowlers who log every pin tend to be more dedicated than the average recreational bowler, so these rates may run higher than for bowlers overall.
Single-Pin Spare Conversion Rates
| Pin left | Conversion rate | Attempts |
|---|---|---|
 2 |
82.2% | 29,547 |
 4 |
80.9% | 73,357 |
 8 |
80.5% | 18,448 |
 3 |
80.2% | 38,187 |
 9 |
79.0% | 33,917 |
 5 |
78.8% | 46,430 |
 6 |
76.0% | 56,879 |
 7 |
70.9% | 91,093 |
 10 |
63.7% | 186,963 |
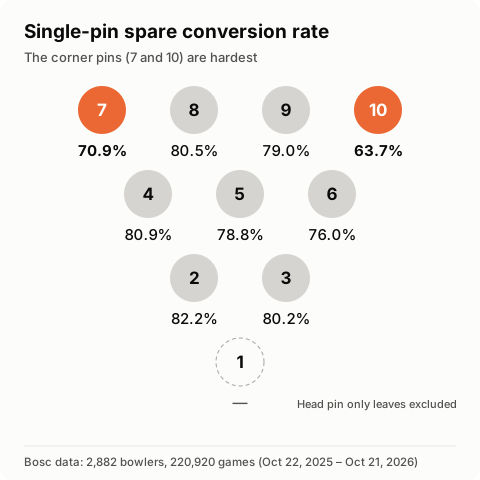
Most single pins are converted 76–82% of the time, but the corner pins drop off: 7 pin at 70.9% and 10 pin at 63.7%.
The 10 pin is left more than twice as often as the 7 pin and has the lowest conversion rate. Since most bowlers are right-handed, getting reliable on the 10 pin is the single biggest opportunity for most players.
Top 10 Most Common Leaves
| Rank | Leave | Conversion rate | Attempts |
|---|---|---|---|
| 1 | 10 |
63.7% | 186,963 |
| 2 | 7 |
70.9% | 91,093 |
| 3 |  6-10 |
66.4% | 75,774 |
| 4 | 4 |
80.9% | 73,357 |
| 5 | 6 |
76.0% | 56,879 |
| 6 |  4-7 |
73.2% | 51,778 |
| 7 | 5 |
78.8% | 46,430 |
| 8 |  3-6-10 |
62.8% | 39,746 |
| 9 | 3 |
80.2% | 38,187 |
| 10 | 9 |
79.0% | 33,917 |
Three of the top 10 leaves (10, 6-10 and 3-6-10) include the 10 pin, adding up to about 300,000 attempts.
Split Conversion Rates
| Leave | Name | Conversion rate | Attempts |
|---|---|---|---|
 2-7 |
Baby split | 45.7% | 6,834 |
 3-10 |
Baby split | 40.3% | 26,071 |
 5-7 |
14.6% | 9,829 | |
 5-10 |
12.1% | 8,002 | |
 6-7 |
3.5% | 6,466 | |
 4-10 |
3.0% | 7,247 | |
 6-7-10 |
3.0% | 13,405 | |
 7-9 |
2.7% | 2,166 | |
 4-7-10 |
2.1% | 13,902 | |
 8-10 |
1.6% | 4,578 | |
 4-6 |
1.1% | 5,163 | |
 7-10 |
0.5% | 11,115 | |
 4-6-7-10 |
Big Four | 0.3% | 8,057 |
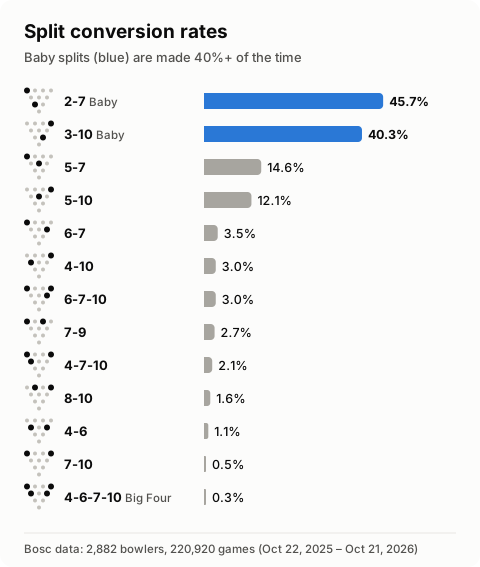
The 7-10 split is picked up about once in every 200 attempts. Baby splits (2-7 and 3-10), on the other hand, are converted more than 40% of the time and are well worth going for.
On wide splits, reliably taking one pin usually costs you less than going for both.
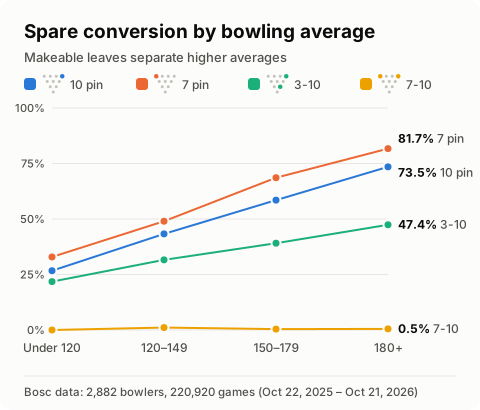
Spare Conversion Rate by Bowling Average
Averages are based on bowlers who logged at least 10 games during the period.
| Leave | Under 120 | 120–149 | 150–179 | 180+ |
|---|---|---|---|---|
| All leaves | 26.9% | 41.6% | 55.9% | 66.7% |
| 10 |
26.7% | 43.3% | 58.5% | 73.5% |
| 7 |
32.9% | 49.0% | 68.6% | 81.7% |
| 6-10 |
35.4% | 51.5% | 65.9% | 76.6% |
| 3-6-10 |
28.8% | 45.1% | 58.8% | 71.6% |
| 3-10 |
21.8% | 31.6% | 39.1% | 47.4% |
| 7-10 |
0% | 1.1% | 0.4% | 0.5% |
| Bowlers | 179 | 493 | 861 | 734 |
As averages rise, conversion on makeable leaves climbs sharply. On the single 10 pin, bowlers averaging 180+ convert about 2.8 times as often as bowlers under 120.
The 7-10 split, however, stays around 1% at every level. Higher averages come from making the makeable spares, not from converting difficult splits.
US vs Japan
| Leave | US | Japan |
|---|---|---|
| All leaves | 55.2% | 56.5% |
| 10 |
59.8% | 64.9% |
| 7 |
70.0% | 71.7% |
| 3-10 |
38.4% | 40.6% |
| 7-10 |
0.7% | 0.5% |
Overall conversion is nearly identical, but US bowlers convert the single 10 pin about 5 points less often than bowlers in Japan. Country is based on each device's region setting.
How to Improve Your Spare Conversion
- Practice single 10 pin and 7 pin spares first. They are the most common leaves with the lowest conversion rates, so they offer the most room to improve.
- Go for baby splits. The 2-7 and 3-10 are converted more than 40% of the time.
- On wide splits, make sure you get one pin. Even bowlers averaging 180+ convert the 7-10 and 4-6 only about 1% of the time.
For more practice ideas, see Tips and Practice for Bowling Beginners to Improve.
Find Your Own Spare Conversion Rate
With the Bosc score tracking app, just record which pins fell on your first ball and Bosc automatically calculates your spare conversion rate for every leave. You can also compare leave-by-leave conversion rates with friends — see how you stack up against the averages in this article.
Wondering how your average compares? See What Percentile Is Your Bowling Average?, and for how many strikes a 200 takes, see How Many Strikes Do You Need to Bowl a 200?
FAQ
What percentage of 10 pins do bowlers pick up?
In Bosc data, the single 10 pin is converted 63.7% of the time. Bowlers averaging 180+ convert it 73.5% of the time, while bowlers averaging under 120 convert it 26.7%.
What are the odds of picking up a 7-10 split?
0.5% (out of 11,115 attempts) — about once in every 200 tries. It stays around 1% at every skill level.
What is the average spare conversion rate?
About 56% across all non-strike frames. By average: 26.9% under 120, 41.6% for 120–149, 55.9% for 150–179 and 66.7% for 180+.
Data in this article comes from scores logged by users of the Bosc bowling score app, aggregated so that no individual can be identified (compiled Oct 22, 2026). If you cite these figures, please link to this article as the source.